
What is Ktrans and MU-Ktrans
In DCE-MRI Ktrans is calculated based on flow of blood from vessel to tissue with the help of DCE-MRI sequence, which take approximately 5 minutes. MU-Ktrans is also calculated based on flow of blood from vessel to tissue with the help of modified DCE-MRI sequence which take one minutes in data acquisition. This saves data acquisition time
The volume transfer constant Ktrans reflects the rate at which gadolinium contrast from blood plasma into the tissue.
MRI Knowledge Hub
DCE-MRI (Dynamic Contrast Enhanced Magnetic Resonance Imaging) acquires a series of images used to calculate and analyze contrast wash-in and wash-out when an intervenous Contrast is injected. The kinetics of DCE-MRI process dependent upon tissue perfusion, vessel permeability, and the volume of extravascular-extracellular space (EES, leakage space ve), Which provide some insight into tumor angiogenesis. Angiogenesis is a critical to the progress of cancer and its metastases.
Today DCE-MRI plays an important role in cancer detection, characterization, stagging, and therapy monitoring/planning. Ktrans which is measure of capillary permeability calculated with DCE-MRI is used to delineate malignant cells.
Advantages OF DCE-MRI
- DCE-MRI is a non-invasive
- No Radiation
- High Spatial Resolution
- High Sinal to noise Ratio
- High Contrast to noise ratio
- High Sensitive to small vessel functions
Functioning of DCE-MRI
In DCE-MRI, a paramagnetic, low molecular weight bolus is used as contrast agent, usually gadopentetate Di meglumine (Gd-DTPA). It is transiently confined within the vascular and subsequently perfuses rapidly into EES through capillary bed, where the relaxation processes of surrounding protons are catalyzed, and the relaxation time is shortened. Here, T1-weighted sequences like flash are favored in the quantification of perfusion, in which the distribution of contrast agent produces the change in signal intensity. Further a series of images with change in signal intensity with time during the distribution of bolus, using fast imaging techniques, such as fast low angle shot (FLASH) MRI. Physiologic and pathologic information concerning the vascularization of tissue in voxel may be derived from this time-signal intensity curve Figure 1, 2.
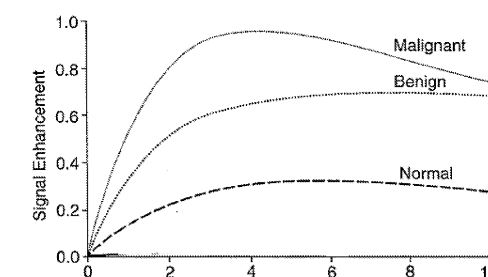
Figure 1: Time intensity curve for DCE-MRI Malignant (a) vs benign (b) tissue. Time intensity curve shows that the slope rise in case of malignant tissue is very sharp as compare to benign and normal tissue.
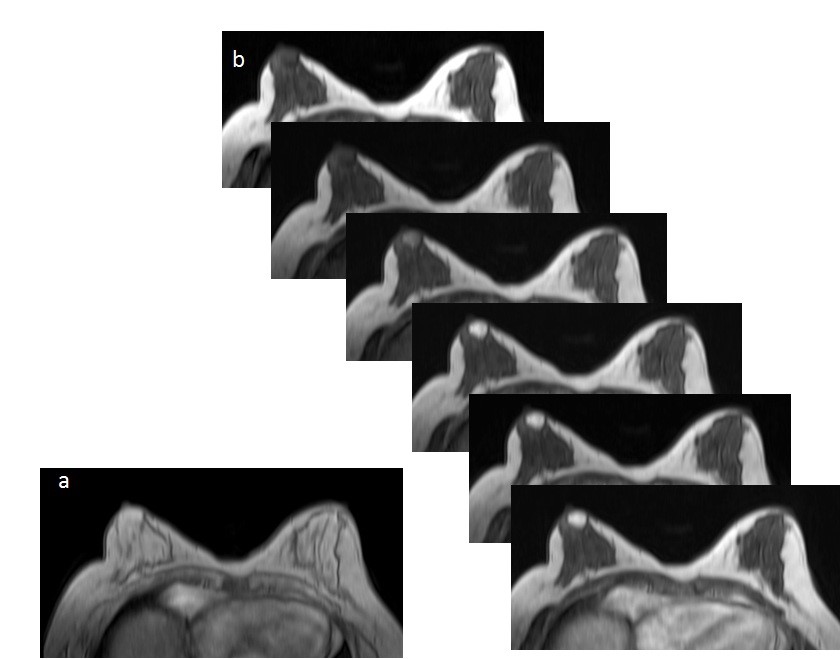
Fig 2. (a) 2 degree Flip Angle (FA) VIBE axial image before contrast and 15 degree FA VIBE axial image for T1 calculation; and, followed by (b) Serial 15 degree (FA) post contrast VIBE axial images with 4.2 Sec temporal resolutions. Note the gradual increase in intensity in the tumor tissue (arrow) as a result of T1 shortening effect due to differential Gadolinium contrast accumulation compared to normal breast tissue.
Challenges in Cancer detection and response therapy
Cancer diagnosis and response therapy by non-invasively through routine MRI images is widely used clinically. But the radiologist/surgeons/clinicians face challenges during image analysis due to soft tissue boundaries, image resolution, image noise etc. DCE-MRI has lot of success stories in improving the diagnosis and monitoring response therapy. This involve analysis of pharmacokinetic parameters calculated during DCE-MRI.
Reducing Scan Time in DCE-MRI
Publication/Patents
US9013182B2 Method for computing pharmacokinetic parameters in MRI; Amarnath Jena, Shashi Bhushan Mehta, and Sangeeta Taneja, Link
US10147186 Multi – Parameter Based Tissue Classification; Amarnath Jena, Shashi Bhushan Mehta, and Sangeeta Taneja, Link
Optimizing MRI Scan Time in the Computation of
Pharmacokinetic Parameters (Ktrans) in Breast
Cancer Diagnosis; Amarnath Jena, DNB (NM), Shashi Bhushan Mehta, (PhD), and Sangeeta Taneja, (MD); OURNAL OF MAGNETIC RESONANCE IMAGING 38:573–579 (2013) Link
Role of quantitative pharmacokinetic parameter (transfer constant: K(trans)) in the characterization of breast lesions on MRI; Jena Amarnath 1, Taneja Sangeeta, Shashi Bhushan Mehta; Indian J Radiol Imaging, 2013 Jan;23(1):19-25. Link