
MRI Visualization
Window width and Window Level in MRI
MRI Knowledge Hub
MRI Visualization
The interpretation of medical images, which primarily lie within the domain of radiology, remained fundamentally unchanged from Roentgen’s discovery of X-ray in 1895 to Magnetic Resonance Imaging. Today, light box is the main prerequisite in every hospital or medical institute to analyse and interpret the image data (The trend is film less diagnostic center). In performing an image interpretation task in medical imaging systems like X-ray, ultrasound, nuclear medicine or MRI, the human eye draws from a battery of intellectual resources in the form of prior knowledge, experience or expectation. Human observation is superbly capable of localizing organs in image, analyzing organ dimensions and distinguishing normal from abnormal anatomical features based on variations in contrast. Unfortunately, the human eye is not fit to make accurate measurements in medical images. In clinical practice, many diagnostic and treatment decisions are taken on the basis of visual estimates of the severity of a condition. In general, such visual estimates suffice to formulate a diagnosis or treatment plan. Today the medical image data tranformed to Digital Image data. This tranformation helps to create multiple interpretations, which helps in postprocessing and analyzing data. The post processing features include visual depictions and segmentation of data. Window width/Window level is an impotation feature being widely used in MRI console.
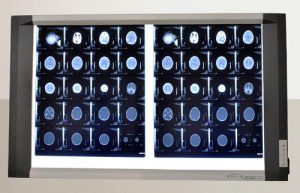
Figure 1: Film box for Visualization
Visualization using Window Width and Window Level Scheme
The pixel intensity of the MR image (Digital Image) varies from intensity value 0 to 4095 (Full range). But in actual the majority of the pixels intensity in MR image dominates in the central portion of histogram. The intensity map (histogram) varies from image to image and depends on various factors (like tissue anatomy, pulse sequence, MR physics, image artifacts and many more). Window width and window level expands the portion of histogram (Small intensity range) to map it on 0-4095 ranges; this results in reducing the background noise and improving image quality. Any intensity range from histogram can be selected to expand it to the full range.
Window width can be defined as the range of intensity values between the lower and upper threshold, which will be mapped to a range of the data values by the height (Height = 4096) as shown in figure below. Here the threshold value (th), window width (WW) and window level (WL) is calculated as per equation 1, 2 given below.
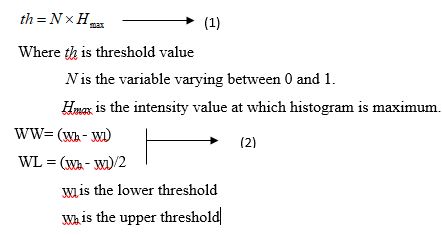
The threshold level (Th) is calculated from the maximum frequency Hmax. From the threshold th, wl (lower threshold), wh (upper threshold) are calculated using the histogram map. The value of Window width WW and window level is calculated as per in equation 2, which can be varied by changing th. One example calculation to calculate WW and WL of MR image data is shown below:
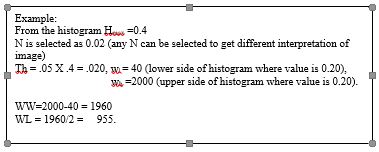
Threshold value can be changed to obtain new window width and window level to generate different interpretations of the MR images. For example; if threshold is increased to th2, or th3, by increasing the value of N it will take the small window of the histogram (Figure 2), which will be expanded to full width 0 – 4095. The expanding of the gray values will improve the image quality. Here the new WW and WL (WW2, WL2 and WW3, WL3) are calculated based on th2 and th3.
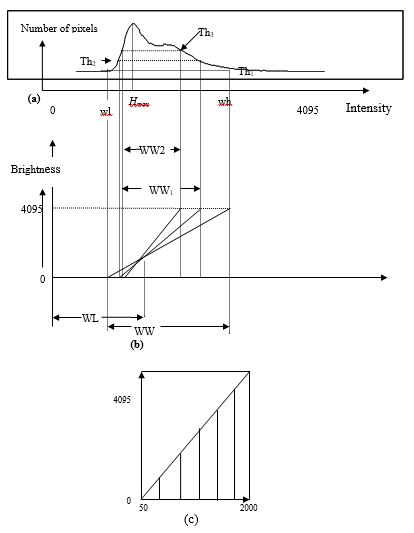
Figure 2 (a) shows the histogram of Image data. (b) shows different WW WL. (C) shows mapping intensity range from 100 - 2000 to 0 - 4095.
Window width and window level is used for:
- To generate optimal image quality automatically or manually and suppressing background noise in the image data set;
- Delineating boundaries of tissue in MR images;
- Generating various interpretations of MR image to aid in diagnosis.
Algorithm to calculate WW and WL to generate optimal image quality Automatically:
- Obtain histogram of the image.
- Calculate the maximum frequency Hmax and Th (Th = N x Hmax) from the histogram figure 3 (It is found N=.05 for optimal image quality).
- Calculate wl and ww from Th (intensity value at which the histogram value is .05x Hmax on both side of Hmax) to calculate WW.
- Calculate Window width WL = (wl + ww)/2.
- Set the WW and WL to get optimum image quality of MR image.
Some times the image quality is not good with automatically setting. In that case either threshold value (th) is changed or WW and WL is manually changed to get good image quality. This feature is used to suppress background noise or match with X-ray film characteristics, while filming. This feature is also useful to delineate tissue boundaries in the MR image as an initial segmentation.
Manually the threshold value can be changed (with different values of N) to get different values of WW and WL, or WW and WL individually, can be changed at different values. This generates different interpretation of image (See figure 3, 4). The figure 2 shows the graphical behavior of WW and WL by changing the threshold values. For example; if threshold is increased to th1, or th2, it will show partial image pixels, suppressing the remaining pixels (figure3). Here the window width and window level WW1, WL1 and WW2, WL2 are corresponding to th1 and th2. This feature helps radiologist to access the disease pattern in the image by using this function. (figure 3 and 4).
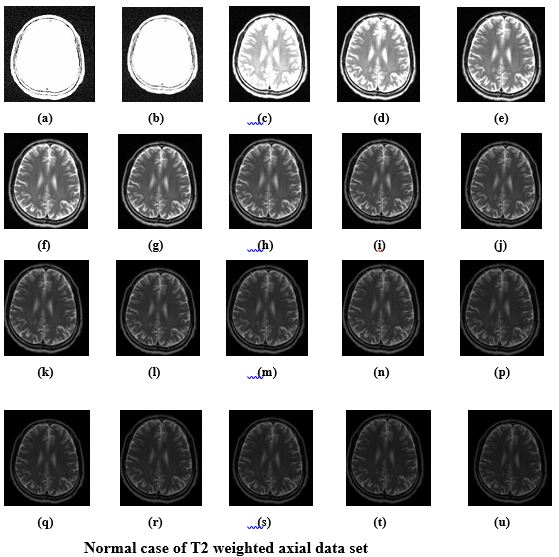
Figure 3
Figure 3 A set of images generated by the Patient diagnostic console to show different interpretation in White matter, Gray Matter, CSF by changing the WW, WL. The WW, WL varied from 200, 100 to 4095, 2050 in the step of WW=200, WL=100.
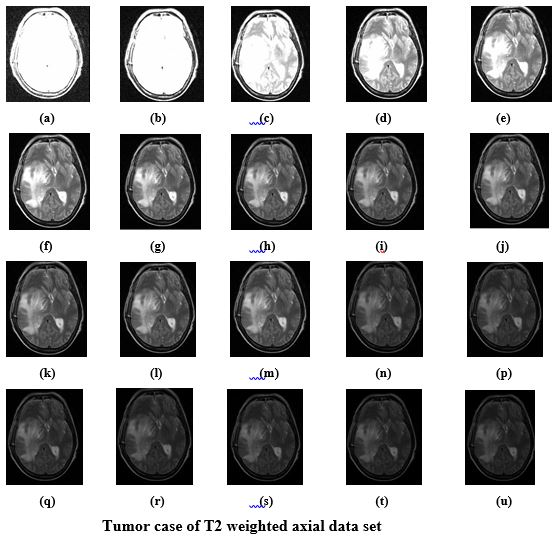
Figure 4
Figure 4: A set of images generated by the Patient diagnostic console to show different interpretation of tumor mass by changing the WW, WL. The WW, WL varied from 200, 100 to 4095, 2050 in the step of WW=200 and WL =100.