MRI Knowledge Hub
Pharmacokinetic Parameters in MRI
Pharmacokinetics in general deals with the kinetics of drug absorption, distribution and elimination. After drug administered orally or through injection in the body is absorbed from the site of administration to the systemic circulation system. The drug is distributed to all parts of the subsequently drug is eliminated from the body by metabolism and/or excretion.
In MRI ktrans is widely used Pharmacokinetic parameters for analysis. It is defined as transfer constant. Other parameters used in DCE-MRI analysis are extracellular volume (ve) and flux rate constant (kep). These parameters on the other hand rely on quantification of vascular events through compartmental modelling. It is a highly potential method to classify the tumor between benign and malignant. High and low Ktrans values of the tumor denote malignant and benign tissue respectively.
What is Ktrans in DCE-MRI
Ktrans is defined as Volume transfer constant or measure of capillary permeability. In DCE-MRI, it is obtained by acquiring serial acquisition of MR images of an organ in question before, during, and after an intravenous injection of Gadolinium-based contrast media. As the Contrast perfuses into the tissue under investigation, the parameter T1 relaxation of tissue decreases to an extent that is determined by the concentration of the contrast agent.
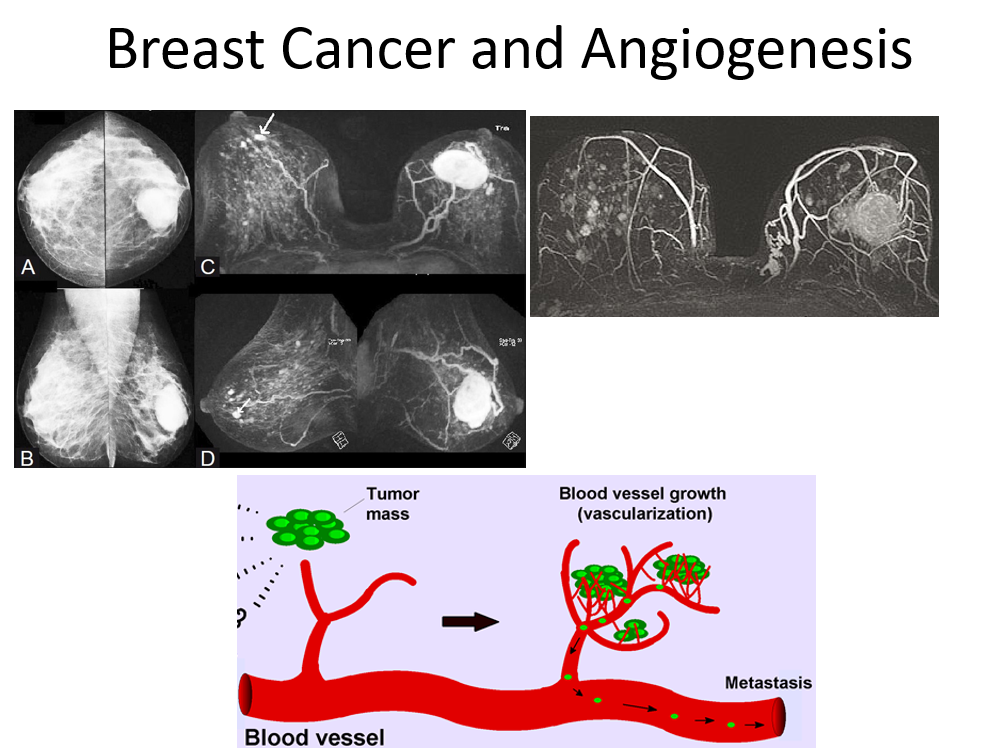
Tumor Tissue, Angiogenesis, and DCE-MRI
The behaviour of tumor tissue is dynamic and keeps changing its environment with time to sustain uncontrolled growth. These changes generate millions of tiny ‘microvessels’ around tumor tissue for nutrition, nevertheless in an enhanced rate with disorganized fashion having poorly formed porous/leaky capillary membrane: a factor long been exploited with MR imaging to capture changes in the pharmacokinetic parameters (permeability etc). As the tumor tissue grows in size from sub millimeter to bigger size, the central portion of the tissue is cut-off from blood supply, resulting in necrosis and myriads of tissue changes like hemorrhage, fibrosis etc resulting in tissue heterogeneity (more typical to cancer tissue) posing problem for tissue characterization. Classifying cancer (malignant) tissue and noncancerous (benign) or normal tissue noninvasively has been a continued challenge to imaging. Routine DCE-MRI with dedicated imaging protocol provides adequate physiological (contrast kinetics), morphological information of the breast. The specificity of routine DCE-MRI however remains equivocal and necessitates the development of techniques which can reliably distinguish benign and malignant breast lesions. DCE-MRI has been explored to distinguish between benign and malignant lesions at high temporal resolution, The basic principle is that malignant tissue reacts to contrast agents differently from benign tissue in terms of time, the way it occupies these molecules, and how much it washes out from the tissue. Contrast molecules affect the observed intensity patterns because they change the relaxation times of the voxel in the image that they reach. Contrast agent uptake curves called ‘wash-in wash-out’ are used to characterize tissue. Cancerous (malignant) tissue usually has a sharp curve rise and a significantly higher enhancement compared with benign tissue, normal or fatty tissue because of qualitative change in the microvasculature (neoangiogenesis) which is leaky, while normal and fatty tissues show low contrast enhancement. These enhancement curves have often been fitted using a pharmacokinetic model (a model which mathematically relates to the concentration of contrast agent in the tissue as a function of time) with various physiological parameters of the tissue such as transfer constant (Ktrans) also termed as permeability factor and an extracellular volume parameter Ve, in an attempt to give a physiologically relevant parameterization of the curve.
References
- Hoffmann U, Brix G, Knopp MV, Hess T, Lorenz WJ. Pharmacokinetic mapping of the breast -a new method for dynamic MR mammography. Magn.Reson.Med. 1995;33(4):506-14.
- Port RE, Knopp MV, Hoffmann U, Milker-Zabel S, Brix G. Multicompartment analysis of gadolinium chelate kinetics: Blood-tissue exchange in mammary tumors as monitored by dynamic MR imaging. J. Magn. Reson. Imaging 1999; 10(3):233-41.
- Boetes C, Barentsz JO, Mus RD, Van Der Sluis RF, van Erning LJ, Hendriks JH, Holland ER, Ruys, SH(1994) MR characterization of suspicious breast lesions with a gadolinium enhanced TurboFLASH subtraction technique. Radiology 193: 777-781
- P Gibbs, G P Liney, M Lowry, P J Kneeshaw, L W Turnbull. Differentiation of benign and malignant sub-1 cm breast lesions using dynamic contrast enhanced MRI. The Breast, Volume 13, Issue 2, April 2004, Pages 115–121
- Jacques A. den Boer, Ruud K.K.M. Hoenderop, Jouke Smink, Gerard Dornseiffen, Paul W.A.A. Koch, Jan H. Mulder, Cornelis H. Slump, Edo D.P. Volker, Rob A.I. de Vos, Pharmacokinetic Analysis of Gd-DTPA Enhancement in Dynamic Three-Dimensional MRI of Breast Lesions. JMRI 1997 3 7:702-715.
- Kim JK, Hong SS, Choi YJ, Park SH, Ahn H, Kim CS, Cho KS, Wash-in rate on the basis of dynamic contrast-enhanced MRI: usefulness for prostate cancer detection and localization. JMRI 2005 Nov;22(5):639-46.
- R. DEICHMANN AND A. HAASE, Quantification of Tl Values by SNAPSHOT-FLASH NMR Imaging, JMRI 96, 608-612 ( 1992).
- David A. Kovar, Marta Lewis, Gregory S. Karczmar. A New Method for Imaging Perfusion and Contrast Extraction Fraction: Input Functions Derived from Reference Tissues. JMRI 1998 8: 1126-1134.