MRI Connectionist
MRI Knowledge Hub
Connectionist approach for Clustering pixel in MRI
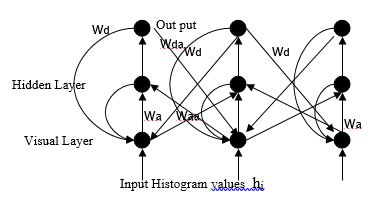
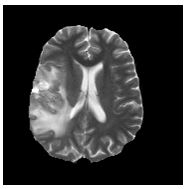
Clustering, in the context of present problem, is the process of grouping pixels on the basis of perceived similarities. These clusters can provide natural partitions of the pixels corresponding to different regions in the image. Traditional clustering algorithms require a priori knowledge about the number of clusters, nature of the data, clustering criterion etc. In algorithms like K-means clustering [1], Fuzzy c-means clustering[2], Kohonen’s self organizing map[3], [4] etc., the exact number of clusters have to be specified beforehand. This is a serious limitation since reliable estimate of the number of clusters in the MR image, in particular, for diseased cases, may not be available a priori. Algorithms based upon ISODATA [5] makes use of user defined criterion for merging and splitting clusters for discovering the number natural clusters in the data. However, defining these splitting and merging criteria, which can be applied for different MR images based upon prior assumptions about intensity distributions is extremely difficult. Histogram based mode separation techniques have the capability to autonomously decide the number of clusters. However, for MR images where histograms are characterized by extremely unequal peaks and broad or flat valleys, these techniques will face difficulties. For tumor cases, where histogram of MR images tend to have flat distribution over a reasonably large range of gray values, mode detection techniques will merge the entire flat region into one cluster since no valleys will be obtained for delineating the clusters. However, to separate out pixels belonging to tumor, edema, necrosis, etc. (see figure) we need to divide this region into different clusters based on some scatter measure. In order to overcome these limitations, the connectionist-clustering scheme proposed in [6] for partitioning the MR images. This architecture makes use of contextual information available in the form of density estimates over a neighborhood in the histogram and propagates these information over the network for identifying prototypes based upon inherent nature of the data distribution so that partitions can be constructed around these prototypes. For example, if a narrow valley in the histogram separates two peaks, this network can identify a cell in between the two peaks which can represent the cluster correctly. Similarly, if the patterns are denser on one side of a peak than the other, then the prototype selection by this network can reflect this asymmetry of the distribution. The prototype selection network has two layers of neurons, one visible and the other hidden (Figure). The visible layer has one neuron corresponding to each cell of the histogram. It receives the frequency count of the corresponding histogram of MR images. The shape of histogram varies due to many reasons like pulse sequence (Spin Echo, Fast Spin Echo, Multi Echo etc.), MR system (.5T, 1T, 1.5, 3T etc.), MR system imperfection, type of receiving RF coils etc. In Multi Echo, as the acquisition of signals in succession becomes progressively weak, the brightness and gradation of each reconstructed image based on each echo varies. The network iteratively smoothes the histogram over progressively increasing neighborhoods around each cell. At any time, the activations of the neurons in the visible layer represent the chances of the corresponding cell being a prototype. Since in each iteration, a neuron collects activations from its neighbors, the point of the highest activation will shift toward regions with higher density. Consequently, the asymmetry of the frequency distribution with respect to the peak is reflected in the prototype selected. When a cell gains sufficient activations from its neighbors, the point of highest activation is accepted as a prototype and the hidden layer triggers an inhibitory process in the neighborhood of the prototype. This inhibitory process also spreads over increasing neighborhoods over time. Since a neuron is accepted as a prototype only after sufficient activation is gained, the smoothing performed will be over neighborhoods depending on the distribution of patterns in that neighborhood. When the network stabilizes, neurons corresponding to prototypes in the histogram have high activation (1.0) and all other cells have low activation.


References
- Jain AK and Dubes RC. Book “Algorithms for Clustering Data”. New york: Prentice-Hall,1988.
- Hall L, Bensaid AM, ClarkeLP, Velthuizen RP, Silbiger MS and Bezdek JC. “A comparison of neural Network and Fuzzy clustering techniques in Segmenting Magnetic Resonance Images of the Brain”. IEEE Transactions of Neural Networks, Vol. 3, No. 5, Sept 1992.
- Kohonen T. “An Introduction to neural computing”. IEEE Neural Networks, 1988, Vol. 1, 3-16.
- Carpenter GA and Grossberg S. “The art of adoptive pattern recognition by self-organizing neural network”. IEEE Computer, March 1988, 77-88.
- Bezdek JC and Hall LO. “Review of MR image Segmentation techniques using pattern recognition”. Medical Physics, Vol. 20, No. 4, pp. 1033-1048, March 1993.
- Vinod VV, Chaudhury S, Mukherjee J and Ghose S. “A Connectionist approach for clustering with applications in image analysis”. IEEE Transactions on Systems, Man, and Cybernetics. March 1994, 24 (3) pp.365-384.
